Persistent Vector Performance
posted
This musing will be filled with very many small details related to persistent and transient vector performance. If you just want a summary of these findings instead this detailed explanation, you should look at the blog post Persistent Vector Performance Summarised instead. It also assumes some familiarity with the persistent vector, so if you haven’t already, you should probably look at my blog post series on the persistent vector.
In the blog post series where I write about how the persistent vector works, I have said that some operations on the persistent vector are effectively/practically O(1) because of the high branching factor, 32. However, in reality, the operations take O(log32 n) time, which is asymptotically the same as O(log n). I initially started this blog post with the goal to explain why a branching factor of 32 was chosen, and why we can consider most operations on the vector to be O(~1). However, when I started benchmarking, I got curious if some small modifications on the source had any impact on performance…

Long story short, I now have a prototype of a new persistent vector implementation. I’ll give some benchmarks for that one, alongside the PersistentVector and TransientVector in Clojure, as well as the basic ArrayList we all know from Java.
Before I go into that, however, we had the case of the somewhat mysterious branching factor of 32. And to understand how that came to be, we need some basic understanding of memory models and memory hierarchies.
Memory Hierarchies
To speed up performance in file systems and databases for ordered data, we usually use B-trees or B+ trees, instead of binary trees. Even though both have O(log n) runtime for most operations, the performance hit of going down to disk is very large. Since going to disk is orders of magnitude slower than going to RAM, so we would like to avoid it as much as possible.
The same reasoning sort-of applies when you compare cache and RAM: Caches are orders of magnitude faster than RAM. Therefore, if you want to improve the performance of a data structure or your program, it makes sense to limit the number of trips to RAM. In addition, the persistent vector doesn’t do that many machine instructions: Compared to memory lookups, the CPU operations are essentially “free”.
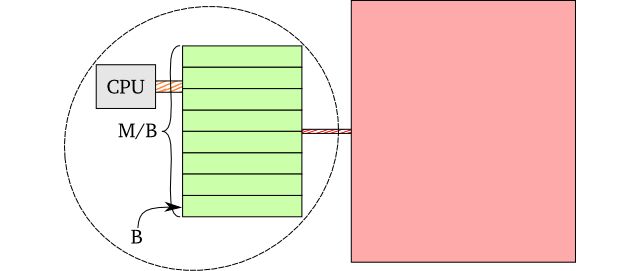
One widespread model used to model disk access is the not so surprisingly named I/O model1, where you say that there is a big cost going out to secondary storage. In it, it is assumed that we have a single type of memory, and some sort of secondary storage. The memory is of size M (we’ll use bytes here, but it can theoretically be anything), and contains block lines of size B. The total number of block lines the memory can contain at once is M/B. Finally, every time you request some data from a specific secondary memory address, you transfer a complete block.
It turns out that this model is not too bad for reasoning around persistent vector performance, by saying that the L1-L3 caches are “memory” and RAM is the secondary storage. Although it doesn’t take into account the different lookup times between the different cache types, the cache line (the block in the I/O model) sizes are usually the same. Additionally, the L1-L3 performance isn’t that different when compared to a RAM lookup.
On most processors these days, all the caches have B = 64 byte large cache lines. If we were to update the persistent vector all the time, we would probably keep the branching factor such that one node uses exactly 64 bytes. For 64-bit machines, we have p = 8 byte large pointers, so we would have a branching factor of 64/8 = 8. A larger branching factor would mean slower updates, as you would need to lookup more cache lines.
Lookups don’t suffer from this problem in theory: When we do lookups, we don’t have to touch the complete node. We can compute the memory address of where the nth value or pointer is. That means a lookup will only require a single cache line hit per node, so the higher branching factor, the better.
As a result, we have an actual tradeoff to make: We can increase the branching factor such that nodes are larger than cache lines, but this means the update times increase. On the other hand, if we keep the branching factor low, a lookup will be slower. The optimal choice thus depends on the number of updates versus the number of lookups.
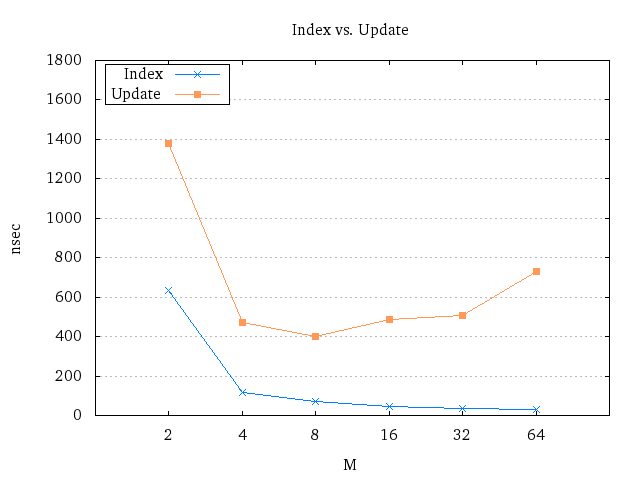
I actually did this sort of benchmarking in my master thesis, as shown in the plot above2. As is suspected, the 8-way branching vector had the best update times, but the performance is roughly the same until the branching factor is set to 64, in which it spikes up. Lookups just seem to monotonically improve, although the performance between 32 and 64 isn’t that different (35 nsec vs. 29 nsec).
From what I can see, having a branching factor of 32 is actually pretty good, and doesn’t sacrifice the update times by too much. It makes sense to pick that one as the branching factor, at least when we have this amount of control.
Reality Kicks In
There is one very optimistic assumption in this the previous section, and that is that we can store an array of pointers like this (I will assume 64-bit OSes for the rest of this blog post):

This is impossible in most languages for a lot of reasons. First, if you want to have transient optimisations, you need to include a transient field. Consequently, you need at least one more pointer in the array (either at the end or at the front). And since Clojure runs on the JVM, let’s see why this doesn’t work there: Arrays on the JVM store their length at the front, which is 4 bytes plus additional 4 bytes for padding. And all object-oriented languages need some way of doing polymorphism. On the JVM, all objects have a pointer to its class’s method table – the klass pointer – which is another 8 bytes added to each object. Finally, on the JVM, each object needs another 8 bytes – the mark word – for additional information. Those 8 bytes are usually for synchronization, identity hash code, and some additional space which the garbage collector can use during GC runs3. So what we would usually expect is something like this:

This sounds a bit bad by itself, but it turns even worse. You see, in the implementation of the persistent vector in Clojure, nodes have their own class and point to an object array. Now a single node looks like this:

The additional constant factor size is bad (24 bytes more than a raw object array), but perhaps even worse is the reference from node to object array. I wouldn’t be surprised if they are usually in the same cache line, but they may potentially not be, meaning that each lookup is now node + object array in the worst case – at worst one more lookup to RAM!
This sounds bad: Not only is the node not fitting exactly into some specified number of cache lines, but it may also require a level of indirection. Fortunately, it turns out that the JVM is a neat beast: If you use less than 32 GB of memory, the JVM can compress object pointers to only 4 bytes4. So in reality, a persistent vector node looks like this:

It’s still not very good that we have a potential level of indirection. Theoretically, it is probably going to be slower. But practically? Without proper benchmarks, we are unable to figure out how much this affects performance. I will show some benchmarks later in this post, but before that, let’s have a look at how much memory this data structure uses.
Memory Usage
I think one of the best ways to measure memory usage of a data structure is to measure the amount of memory not used for storing the elements in it: The memory overhead. Usually, the memory overhead ratio stabilises after some number of elements – or its average is easy to compute – and that’s what we’re interested in. The memory overhead ratio is simply the memory not used on elements we store, divided by total memory used. As an example, we can imagine a simplified version of the ArrayList, which looks like this internally:
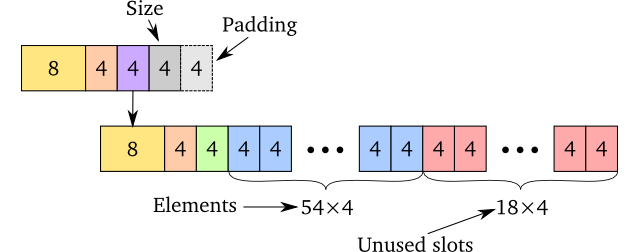
In this case, the memory overhead is the memory not used on the 54 elements stored in memory. The 54 elements use 4 bytes each and take up 216 bytes. In addition, there are 18 unused slots (72 bytes), and a constant overhead of 40 bytes. So the overhead for this particular “ArrayList” is
\[\cfrac{40+72}{216+40+72}=\cfrac{14}{41}\approx0.341\]
From the calculations, we see that 34.1% of the memory used is not on the elements. Put differently, we have to use 2.07 additional bytes per element we have inserted into this “ArrayList”.
What’s good about the memory overhead ratio is that it’s “surprisingly” easy to estimate, in stark contrast to time performance. While it’s easy to do for an ArrayList, it is not that hard to do for the persistent vectors either. I’ve done the groundwork for us5, and for sufficiently large vectors, the overhead can be approximated by the expression
\[ \cfrac{o+p}{o+p+(N-1)|\tau|} \]
Here, o is the constant overhead per node. p is the size of a pointer, N is the branching factor and \(|\tau|\) is the size of elements contained in the vector. On the JVM, \(\tau\) is usually a pointer to an actual object, because primitives don’t work nicely with generics6.
In our case, p = \(|\tau|\) = 4 bytes. N = 32, but we have to look at the internal vector structure again to calculate o correctly. The Clojure’s persistent vector node structure looks like this:

One of the things I’ve done in my implementation is to flatten the node into a single piece of contiguous memory, using an object array. As a result, my implementation has a memory layout like this:

The last two 4 byte blocks are the transient ID and padding.
As we see, in the Clojure implementation we have 24 + 16 = 40 bytes constant
overhead per node. The object[] implementation has only 24 bytes constant
overhead. Using the formula above, we get 26.2% overhead for the Clojure
implementation and 18.4% overhead for the object[] implementation. Flipped
around, this means that for every element we insert, we need an additional 1.42
bytes for the Clojure version, and 0.90 bytes for the object[] version.
At first, it doesn’t sound too bad, but not particularly efficient either. But in fact, it is incredibly efficient, at least compared to other data structures shipped with the standard JVMs. The LinkedList has 83.3% memory overhead (20 bytes per element!), and the TreeMap has 80% (16 bytes)7. The most efficient one is the ArrayList, which on average uses 12.5% (0.57 bytes), but it can be as high as 25% and as low as ~0%.
One question then, is how much the minimal possible overhead for a persistent vector node could be. If you assume you need 4 bytes for the garbage collector, 8 seems to be the minimum: You need an additional 4 bytes for the transient ID. When we use the formula above, this turns into an impressive 8.82% memory overhead ratio, only 0.39 bytes overhead per element! However, this is not realistic unless you have this built-in into the runtime of the language you use, or implement it in a statically compiled language with very good control over memory layouts.
Time From an Analytical Perspective
As I wrote earlier, it’s much easier to calculate memory than it is to estimate time. Let’s try it anyway before we do actual benchmarks. Although it shouldn’t be used as a way to measure time performance, it may give us clues on how to interpret the measurements we see, and how to do the benchmarks properly.
One of the ways we can do this is by estimating the number of cache lines we need for different operations on the persistent vector. I’ve developed some formulas using some optimistic assumptions which are available within the python script formulas.py. The assumptions are written in the script itself if you’re curious.
Appends and Pops
Playing around with the algorithms, we can see some trends. The first thing we obviously notice is that inserting a full tail requires more cache lines than updating the current tail. Here is the plot with the number of cache lines required for tail insertion – the dashed line represents the cache lines required for memory allocations, whereas the solid line is the number of cache line lookups/reads on existing memory.

While not completely evident, the number of cache lines required increases with the trie height – 1024 is the point where the trie height increases from 2 to 3, thus the spike there. The small dips in cache line reads happens when there is not enough space for the tail in the node at level 2. In that case, we don’t even bother to look in it, and just create a new empty node instead. This happens 1 out of 32 tail insertions8.
But these tail insertions happens relatively infrequently – if you do 32 insertions, only one will insert a tail into the trie. The other 31 will just update the current tail. Updating the tail itself is much more efficient, and is “independent” of the number of elements in the vector:

The only thing which changes here is the tail size. As the Clojure tail extends over 3 cache lines at most, it will have this period between 1-3 cache lines depending on the tail size. The additional cache line is for the vector head itself.
The plots for popping are more or less identical, the only difference being that the allocations and reads are inverted, and that tail replacement happens when the vector length is a multiple of 32 + 1.
Updates and Lookups
Updates and lookups are way more predictable compared to pops and appends. Tail lookups require at worst 3 cache lines: The vector head, bound check9, and the actual lookup. Tail updates require copying of the vector head plus the tail.
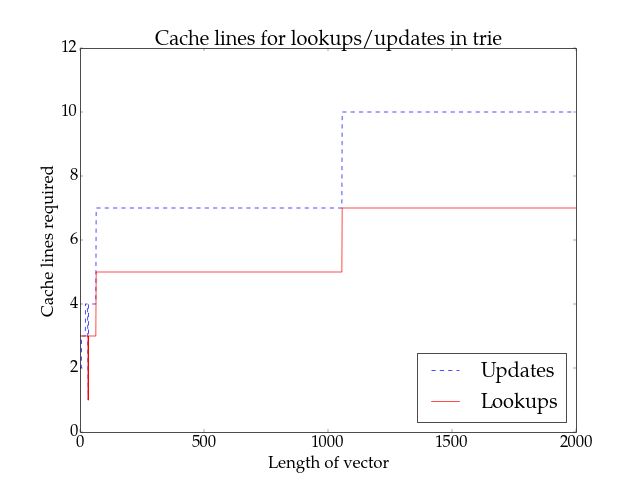
Updates on the trie itself require all levels fully copied, whereas lookups only require at most 2 cache lines (length check + lookup value) per level. The plot above shows this trend, along with the increase which happens exactly at each height increase.
Takeaways
Since we can’t really use this directly to measure actual performance, what can we actually take away from this? Well – we should measure tries with different heights, that much is obvious. Whenever we measure, we should also separate tail and trie operations – the latter is more costly than the former. Although these things don’t come as a big surprise – you can understand that even without cache line formulas and pretty plots – it strengthens the fact that we have to do it.
And this is where the memory overhead we calculated earlier plays a role: The less memory overhead, the more of the actual data we can put into the cache. This usually applies to all kinds of plots, the ArrayList being a notable exception here.
Still, all of these are just analytical calculations and won’t magically infer the time as effectively constant – or anything else, for that matter. We still have to do some sort of benchmark compared to another data structure.
Lies, Damn Lies and Benchmarks
Benchmarking your application properly is really hard. It turns even harder when you design data structures because everyone will use them differently. Different programs utilise the cache differently, there will be different ratios for lookups vs. updates, and the underlying setup and hardware is most certainly going to be different as well. As such, these benchmarks will not measure how these data structures work in your application. This is one of the reasons I have been focusing so hard on explaining how the persistent vector works in the blog post series about it.
I’ve decided to delegate most of the benchmark issues to JMH to avoid the biggest pitfalls. Even then, it is really hard to do these benchmarks accurate, even if they do not portray the real world. You’ll have to take care of interfering programs, power settings turning on and off, and even environment variables.
To make matters worse, it is really hard to compare a mutable/transient data structure to a persistent one. Measuring a single push or pop on a persistent data structure is “piece of cake”, as long as you sample different sizes correctly. That’s not the case for mutable data structures: You’d have to build it from scratch every time, which introduces the possibility for many microbenchmark issues.
I decided to benchmark updates, lookups, appends, pops, iteration and a “full run”. Because of all of these potential issues explained above, it is done with as few memory allocations as possible. This makes the results more reliable, but it’s also making the cache usage more unrealistic compared to a real program.
If you want to know the setup used to produce these results, you can look it up in my thesis at the beginning of chapter 9. It’s the same computer with the same setup10.
So, what are we waiting for? Let the plots commence!
Update
Updates are rather easy to measure. First, we insert a bunch of objects into the data structure, then we benchmark how costly it is to replace one element at a random location. Since the size doesn’t change for ArrayLists and Transient vectors, they are also included.
It should be noted that the benchmark only measures how efficient an update within the trie is. Updating a tail element is going to be much faster, and it wouldn’t be fair to include those times.
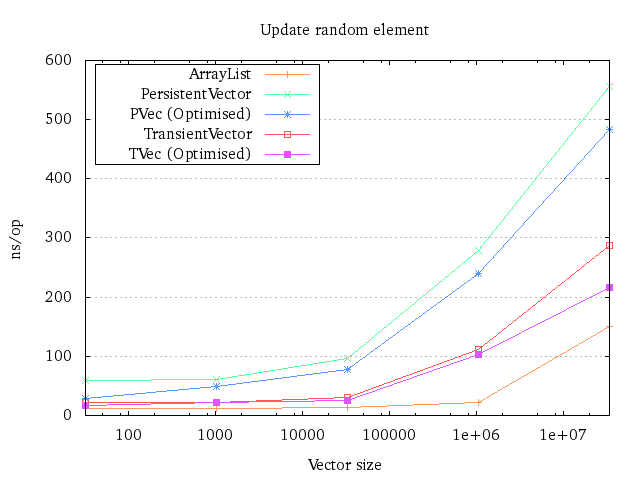
There is not much to discuss in this plot: It’s pretty clear that the persistent vector can’t keep up with the ArrayList here. That’s to be expected due to the indirection. The spike at the end shows what happens when you fill your L3 cache and end up with a lot of cache misses11.
Lookup
The lookup benchmark does the same thing as the update benchmark: It only looks at elements inside the trie, so peeking into the tail is not allowed. There’s no point in having the transient in this benchmark, the only difference from the persistent one being that the transient has to check that the transient ID is not null before walking the trie.
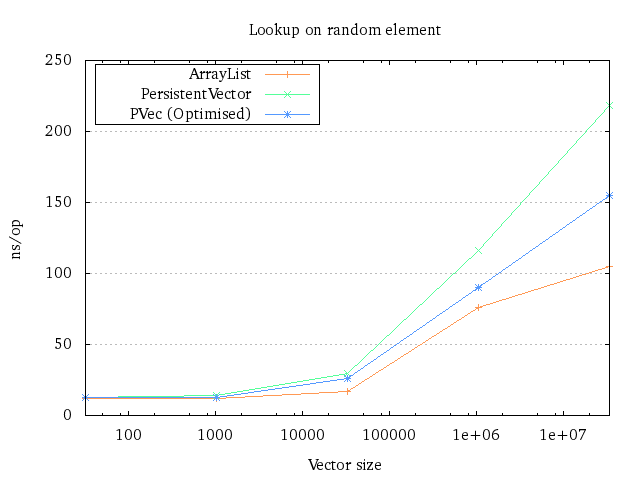
I was a bit surprised that the vector implementation could more or less keep up with the ArrayList implementation here. I would have guessed the persistent vector lookup times would slowly degrade compared to the ArrayList, but it only shows a steeper increase after 1 million elements.
The difference between the original persistent vector implementation and the
optimised one is probably due to the indirection of the Node class: It seems
unreasonable that the performance will differ by that much due to only
algorithmic differences. The same thing presumably happens in the update plot as
well, between the different transient implementations.
Appending
Benchmarking appends in the persistent vector does require some more thought than the previous benchmarks: The fact that the append function is amortized makes it slightly more complicated to calculate the average append times. First, you would have to measure the average amount of time for a tail insertion. Second, you would have to measure the average amount of time inserting into the trie.
The first part is easy, but the second is slightly more complex: In the best case, the height of the trie is increased and you don’t actually have to do peek into any internal node in the trie (See root overflow for more information). That reduces potential cache misses by a lot. In the worst case, however, we would have to traverse and copy nodes in the trie down to the second lowest node, which could create a lot of cache misses.
I decided to just take the worst case instead, because finding the “average” append time actually would require a lot of time. It’s unlikely to be very different from the average case, so worst case is a reasonable estimate.
Therefore, the plot below is an aggregate of two measurements: Average time for tail insertions and worst case time inserting tails into the trie. The formula is thus
\[\frac{\text{(tail insertion)}\times 31 + \text{(trie insertion)}}{32}\]
which is a good enough approximation of amortized append times.
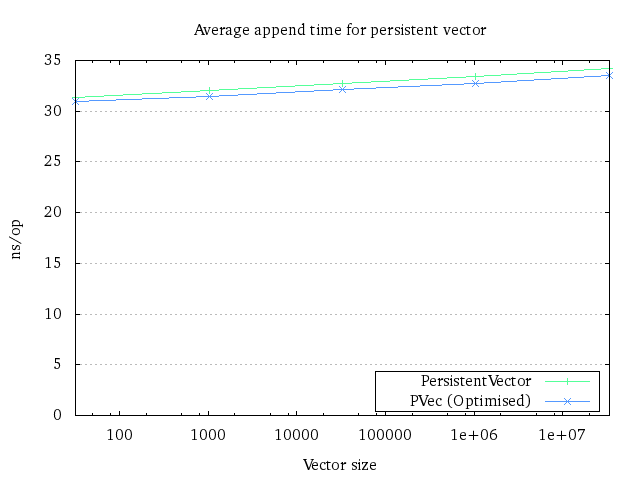
This plot is probably a good example of how you can potentially misinterpret results for two reasons. First and foremost, it seems like appends are way faster than updates. This is true due to the tail, but it would still look like it even if we just compare the worst case times: For 1 million elements, the benchmark measures a trie insertion to ~100 ns/op (~82 for the optimised version), whereas an update takes a little under 300 ns/op. But this is because it’s likely that a random update will have a cache miss, whereas an insertion into the trie in these benchmarks will virtually never have a cache miss. It’s generally more likely that inserting a tail into the trie is faster, but it’s not impossible to create situations where updates are more efficient (especially clustered updates). It shows that you should not generally compare results from different benchmarks because you will usually get wrong conclusions from it.
The second misinterpretation is that the optimised vector implementation is not that much faster. This is true for an average append, but that’s because 31 out of 32 times, you will end up with the exact same performance. However, when you have to insert the tail into the trie, the optimised version is about 20% faster on average.
It is perhaps more interesting to see how repeated appends work, as you can
actually compare persistent vectors, transient vectors and ArrayLists together.
So I decided to run a benchmark where you start out with an empty data
structure and append null over and over again until you’ve reached the
desired size.
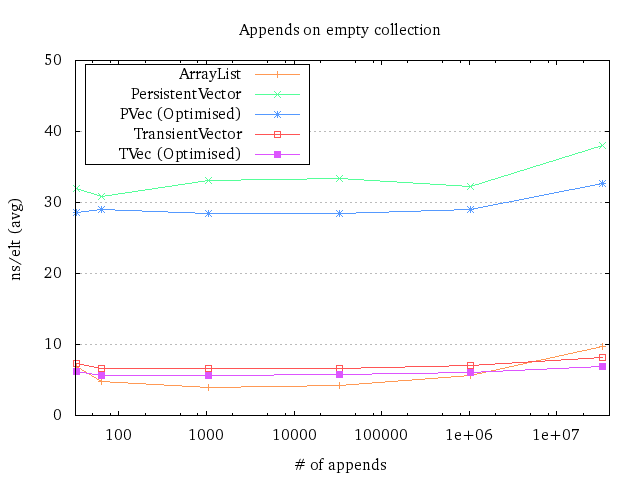
Interestingly, the performance seems to be about constant for all data structures until the ~33.5 million mark, where stuff goes out of the cache. What came as a slight surprise was the fact that the transients are faster than the ArrayList for 33.5 million elements12. I initially suspected that the ArrayList had to expand right before a run was done, but that was not the case: The last expansion happened with 25’764’983 elements, in which it grew to a capacity of 38’647’475. Its end size was 33’554’464, so presumably copying just takes time.
Again this doesn’t necessarily mean transients are faster in general. I would guess transients being faster than ArrayLists in performance-tuned code will more or less never happen.
It’s also a good example of how constant factor matters and that asymptotic behaviour might be deceiving. For this task, both the persistent vectors and transients run in O(n log n) time, whereas the ArrayList runs in O(n). However, it certainly doesn’t seem like it!
Popping
Popping is very similar to appending. In 32 pops, 31 will operate on the tail only, and 1 will have to walk the trie to find the new tail. So we do as we do with the append: We measure pop times for different tail sizes, along with the worst case times for fetching a new tail from the trie.
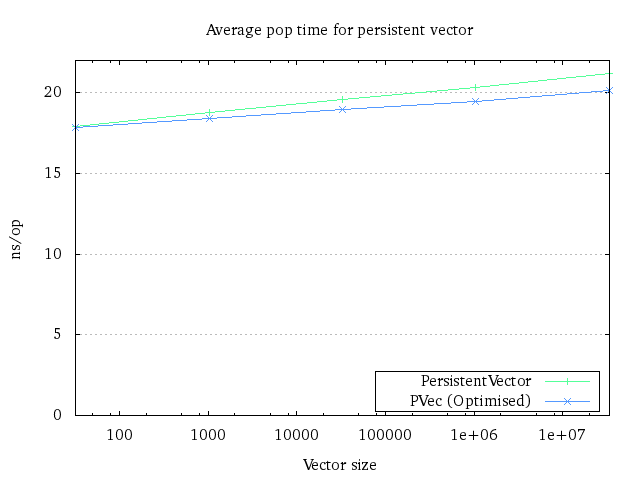
It is possible to see that the runtime for the optimised version improves with size. I have no idea why the difference is greater than the append benchmark, but my go-to excuse (for now) is that my pop implementation somehow is easier to optimise for the JVM without really knowing why.
Of course, we can also see how long time it takes to pop off all the elements:
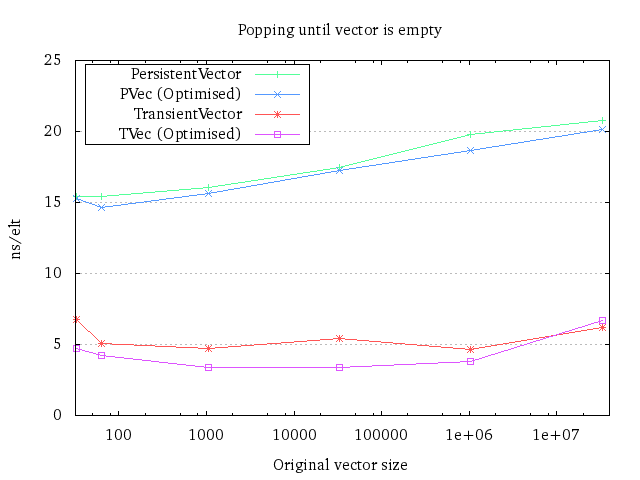
Curiously, it seems like popping is affected by size, which doesn’t seem to be the case for appends. However, notice that pops require 20 ns/element at most, whereas appends use consistently 30 ns/element.
There is a specific reason why the ArrayList isn’t in this benchmark. The transients are created by taking a persistent implementation and making a transient out of it. That’s not possible with an ArrayList, so the option would be to create one every time we do the benchmark. The problem with that is that we then would have to remove the time it takes to create the ArrayList, which makes the results for the ArrayList a lot more volatile. I decided to keep them out instead, instead of having some results that I most likely will misinterpret.
Iteration
Iteration is perhaps the only thing that directly came out of my background work for my master’s thesis. The original persistent vector iterator runs in an amortized O(log n) time per element, with a low constant factor. During my time trying to prove this, a better algorithm popped up in my head. So if we do some more bookkeeping, we can make it run in amortized O(1) time per element.
The trick is simple: Keep a stack of all the nodes down to the current leaf node you’re traversing. When you reach the boundary of a leaf node, go up and replace the leaf node with next leaf node. If we’ve reached the end of that internal node, go to its parent and replace it. Keep doing this until you’ve finally found the next leaf node. With some math, you can prove that this is amortized O(1) time per element13.
There’s a slight startup cost related to this, which is noticeable for small vectors. However, compared to the incredible gains for larger vectors, the cost is insignificant. If the new startup costs are considered too large, it might be reasonable to look into returning different iterators depending on the vector’s size.
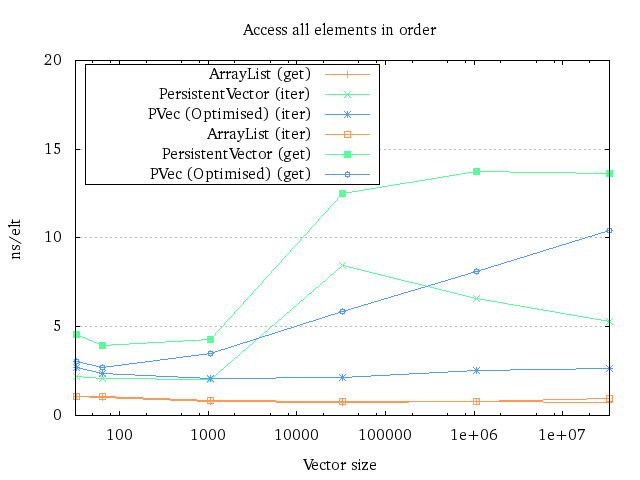
As you can see, the performance characteristics are completely different between the different algorithms. Curiously though, the performance of the current persistent vector iterator seems to improve with more elements, for unknown reasons. Suggestions why this is the case are welcome.
The (get) benchmark is just a for loop doing a get call on all elements in
order, like this:
for (int i = 0; i < size; i++) {
  sum += p.get(i);
}
An interesting observation is that this form of looping seems to be more efficient than using the iterator for ArrayLists if you know the size up front.
Full Run
To have some sort of an “actual” program, I decided to make up something which utilises all operations mentioned above – with the exception of update. The “full run” program works like this:
Coll c = new Coll();
for (int i = 0; i < size; i++) {
  c = c.push(some_int_constant);
}
long sum = 0;
for (Object o : c) {
// or for (int i = 0; i < size; i++)
// depending on what's faster
  sum += (Integer) o;
}
for (int i = 0; i < size; i++) {
  c = c.pop();
}
return sum + c.size();
It’s certainly not a representative program, the data structures benchmarked aren’t generally used in this fashion. However, it’s the easiest thing I could come up with. Perhaps I will implement some well-known algorithms – like Dijkstra’s – later on, to represent some more realistic use cases.

The persistent vector implementation seems to be roughly a factor of 5 slower than the ArrayList on average (a little less with the optimised version), whereas there is almost no difference between the optimised transient vector and the ArrayList. And sure, the transient actually “beats” the ArrayList for 33.5 million elements, but again, take the benchmarks with a grain of salt.
One important note here is that the TransientVector in Clojure doesn’t implement the Iterable interface, but my TVec does. Whether it is sensible to implement Iterable or not on a transient is a different discussion, but it means that the TVec has an “unfair” advantage over its sibling.
Optimisation Attempts
So, as seen in many of the benchmarks, the vector implementation I designed
seems to be faster overall. What are the tricks? One already mentioned is
keeping everything in an object[] array instead of in a Node class. But
there are some other tricks in there as well.
Most of the optimisation attempts come indirectly from my master thesis. Some came after I had to write language independent pseudocode, whereas others came as a result after I wanted to theoretically prove a property.
I decided to not measure each of these optimisations individually, as (from experience) it would take ages to do so. In addition, as grandmaster Zach Tellman once told us, performance is almost never the sum of its parts. Therefore, a good statistical analysis would require me to measure all permutations of optimisations. Instead of doing that, I decided to go for a rather “lazy” analytical approach where I compare the differences analytically and used it if I found its performance to be better than the original.
Convert Recursion to For Loops
When I worked on my master’s thesis, I unwrapped the algorithms so they didn’t have to use recursion and consume space on the stack. On the JVM, I assume that’s not that big of a deal. The maximal recursion steps would be 5, and as far as I understand, the JVM can inline recursive calls up to some predefined size when it decides that it is reasonable. However, I would expect a slight performance increase – probably not gigantic, but still there.
Therefore, I decided to use for loops instead, and store required values in
temporary variables. As an example of this conversion, you can see the
difference between my pushLeaf versus the pushTail
implementation. They both do the same thing but in very different ways.
Reduce Level of Indirection for Small Arrays
A persistent vector in Clojure between 33 and 64 elements will have an internal node as root, although the internal node only points to a single filled leaf node. I decided to avoid the level of indirection, so there’s no internal node, just the leaf node as root. It does require a special case when appending and popping a tail, but apart from that doesn’t require anything special.
As should not be surprising, for vectors with size 33-64, the performance for lookups got somewhat better, and the performance for updating a value in the trie got much better.
Reuse Computed Constants
This was actually a failed attempt and caused some headache for me. For quite some time, I just couldn’t figure out why my average pop runtimes were worse than the original PersistentVector implementation, as they were more or less equivalent. It turns out that some hand-written optimisations might confuse the JVM, which then writes suboptimal machine code:
Assume you have an array and want to create a copy of it, where the last element is removed. You can do this like so:
Object[] newArr = new Object[arr.length - 1];
System.arraycopy(arr, 0, newArr, 0, newArr.length);
This seems good, but assume we already know arr.length - 1 somehow – let’s say
it’s stored in variable n from a very cheap computation we already had to do
anyway. It wouldn’t be too surprising if this block of code is faster:
Object[] newArr = new Object[n];
System.arraycopy(arr, 0, newArr, 0, n);
However, this is in fact twice as slow as the former block for small arrays.
Improve Iteration
I have already explained how we can improve iteration performance: Using an algorithm with a better asymptotic runtime with almost the same constant factors is going to help you. Iterating over the structure in Θ(n) time is, in this case, faster than doing it in Θ(n log n) time.
Bypassing the Length Check
I also attempted to bypass the length check done by the JVM through
sun.misc.Unsafe. The results weren’t as good as I anticipated – on average,
they were worse than the ones using normal array access. Presumably, that’s
because I had to store the Unsafe object internally, and looking up the object
for every method call seems to take more time than just doing bounds checking.
Conclusion
So what can we take away from this? One of the things is that O(log n) can be faster than O(1) given the right constant factors. Does it mean that the persistent vector operations can be considered O(~1)? It’s a highly subjective question, but my feeling is that in most cases, it can be considered effectively constant. In hot spots within performance-sensitive systems, this “effectively constant time” statement obviously falls apart.
Another thing we can take away from this is that the Persistent Vector
implemented in Clojure can most likely be improved – which is great! Clojurians
would certainly not mind if their programs suddenly ran faster, and Clojure.core
has actually recently improved the
vec function, meaning that
some of these results might come into Clojure core someday (but certainly not
for 1.7, I’m afraid).
However, before that can happen, there are a couple of hoops one has to jump
through: The redesign of the algorithms means that other people need to verify
that this is sound, which can take some time. Another hoop is that the
conversion from Node to object[] will break things like
core.rrb-vector, and in the worst
case can’t be compatible because of the Node → object[] transition. Finally,
there are probably some more benchmarks that needs to be done, especially for
smaller vectors to ensure that the performance doesn’t degrade. I’m not a master
on benchmarking either, so it might be that I have interpreted some of these
benchmarks wrong. But at least initially, this seems like good news.
Possible Further Optimisations
There are a couple of optimisation avenues I haven’t explored yet, but have noted down. Some of them are reasonable, and one of them fit well into the premature optimisation space.
(You might want to skip this last part unless you’re interested in potential optimisations I’m assuming might be interesting to look into.)
Loop Unroll
Since we know that the maximum numnber of iterations in a for loop will be 5, it is possible to loop unroll everything. I am not sure how smart this will be, however: It will eat space in the instruction cache, so overall time for your application might actually degrade by doing so. In Java, you can replace the for loops with a switch statement, which is easy.
If you have control over the machine code, you can go completely bananas and attempt to improve it even more: As all steps with the exception of the last are exactly the same, they use the same number of of machine instructions. Therefore, you can, in theory, do a relative jump to the right position with the formula
\[n(h_{max} - h(P)) + \text{offset}\]
where n is the number of of machine instructions per level, and h(P) is the persistent vector height.
Clearly, you have to be somewhat crazy to attempt this, and you also give up portability. But if you’re interested in relatively absurd micro-optimisations, feel free to try this one out.
Fit Exactly into Cache Lines
As earlier mentioned, the nodes don’t fit into a single cache line at all. If we assume that a node will start at a cache line, it might be more efficient to have an implementation that branches out so that the node fits in exactly n cache lines.
For branching, then, you probably have to store the capacity of the trie and perform modulo and idiv operations. Considering the capacity will be divided on a constant, it’s likely that they can be optimised into something more efficient.
Transient Object at Front Instead of Back
If the bounds check has to be done anyway, it makes sense to keep the transient ID spatially close, as it also has to be checked for transients. This should, therefore, reduce the number of cache hits on average, at the small cost of incrementing the subindex by one at each level.
-
The article in which the I/O model was first coined is by “The input/output complexity of sorting and related problems” (1988) by A. Aggarwal and J. S. Vitter . I do some small modifications for simplicity’s sake, like setting P=1 and considering the memory transfers to be done automatically by the computer. ↩
-
On a persistent vector with 500 000 elements. Timing was done by running 10 000 000 random updates/lookups on the vector trie (an implementation not using tails). The average of the interquartile range of 100 runs is the result presented.
Don’t consider the update times to be the actual times used for an update, rather consider them to be relative times to eachother. The GC has certainly kicked in during the runs, so these timings also include that.
The eagle-eyed reader will notice that the update results are slower than the Java version. This is most likely because the implementation was done in C using the Boehm-GC without precise mode, the pointers are actually 8 bytes big instead of 4, and I did not spend much time tweaking the Boehm-GC performance nor the persistent vector implementation.
-
This entire paragraph assumes that the internal representation of the JVM is like this. However, the JVM spec doesn’t give you any constraints on how the interals should look like.
So to be precise, this is how the 64-bit version of OpenJDK 1.7 works, and I’ve verified this with JOL. ↩
-
People might go “What? Wouldn’t 4 bytes only be able to address 4 GB of memory only?”. This is true, but ordinary java objects always has an address which is a multiple of 8 (8 byte aligned). This means all object addresses ends with the binary digits
000, and we can remove those 3 bits in the address itself. This makes it possible to address 8 times as much memory: 32 GB. ↩ -
My thesis has the gory details covered. See section 2.9 on “Performance”. Warning: There is a tiny bit of math on those pages. It might look daunting, but it’s only geometric series and basic calculus. ↩
-
But you can design specially crafted vectors for the primitive you need, see Clojure’s gvec implementation. ↩
-
Here’s the math behind it: Each key/value pair is stored in a node class called Entry. The Entry object has 16 bytes standard overhead, the key (4 bytes), the value (4 bytes), left child (4), right child (4), its parent (4), a boolean for red-black (1 byte) and padding (3 byte). In total, a single node needs 40 bytes, where 8 bytes are used on the content itself. So we have
\[\cfrac{40-8}{40} = \cfrac{8}{10}\]
that is, 80% overhead.
As for the ArrayList, it’s important to realise that it can be trimmed to optimal size. It can also be set to a specified size at initiation, which means that you can avoid the overhead altogether if you know the size ahead of time.
A higher branching factor could reduce the overhead related to the Persistent Vector, but it would also increase update times. ↩
-
What is not visible here is that every 322 tail insertion would make level 3 nodes completely full, leading to even fewer cache line reads. This applies for every 32nth insertion, where the level n+1 node doesn’t have to be read. ↩
-
On the JVM, the length check is always done so that
IndexOutOfBoundsExceptionscan be thrown if we attempt to access elements outside the actual array. ↩ -
This can be found in my master’s at page 81.
The only difference is that I use java instead of C. The JDK version I used emits the following:
java version "1.7.0_65" OpenJDK Runtime Environment (IcedTea 2.5.3) (7u71-2.5.3-2) OpenJDK 64-Bit Server VM (build 24.65-b04, mixed mode)Finally, people should be able to look at the the source for this benchmark. It is found at the GitHub repository named pvec-perf. The repository also contains formulas for cache line estimation and the persistent vector implementation. If you find anything suspicious, feel free to submit an issue. ↩
-
People might wonder why I insert a
new Object()in the update benchmarks, rather than justnull. It seems like the JVM optimises away the insertion for the ArrayList implementation, or does some black magic which removes a lot of work in a real situation: The vector implementation performance barely change, whereas the ArrayList performance change quite drastically. ↩ -
Yes, it’s possible to specify the initial size for an ArrayList, which makes it faster. It’s also possible to just make an array at that point. So in a real world situation, this will probably not happen if the program is optimised well. ↩
-
This one is proved in my master’s Theorem 2.5 in section 2.8 about Displays. ↩